
 Description:
Social media are swamped with different kinds of misleading data. Factchecks can be an effective mean to combat textual and verbal misinformation, but little is known about how this can be done for visual information such as graphs. In this interdisciplinary project with Winnifred Wijnker, Ionica Smeets, and Peter Burger, we investigate how to counter misleading graphs, e.g. with a better graph or a clear explanation?
Read more about the project on Leiden University’s website.
Output:
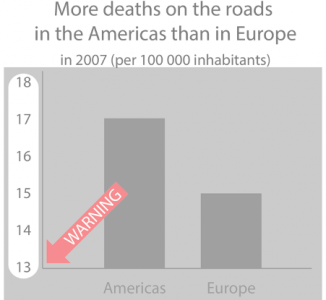
In the first experiment, we studied bar charts with an omitted baseline in the vertical axis. We compared the effect of four different forms of correcting this misleading axis. The results are published in the pre-print of our article.
In the second experiment we will focus on people with low graph literacy; do they require a different type of factcheck?
Funding:
This research is supported by Leiden University Fund (www.luf.nl, LUF Lustrum Grant 2020, W20719-1-LLS).